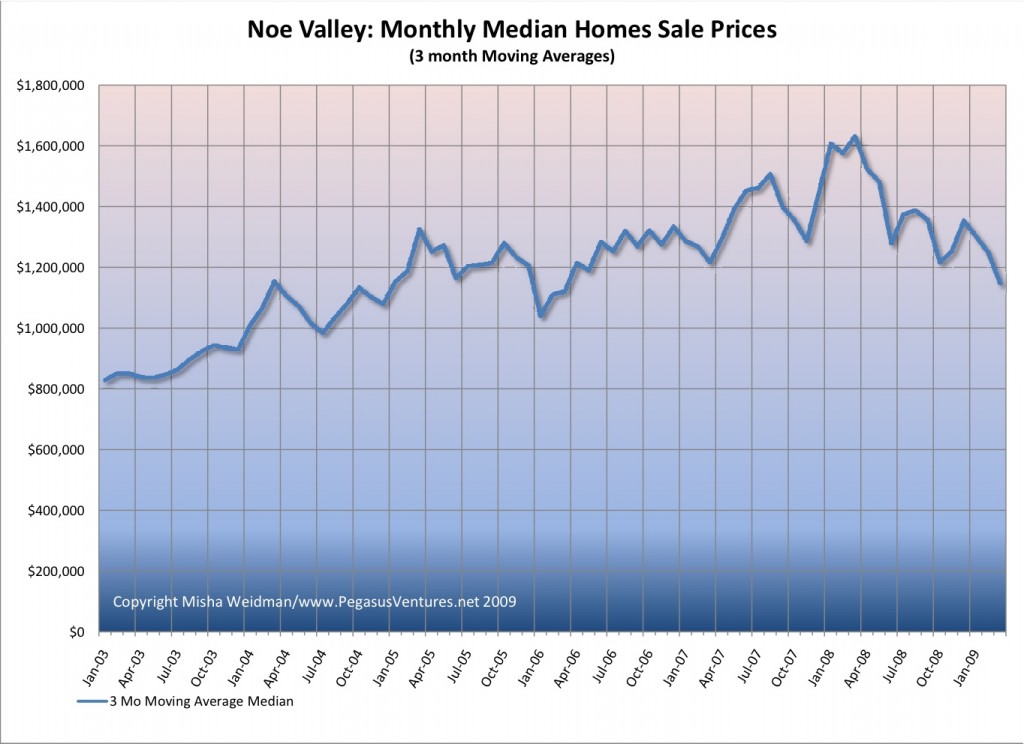
I’ve been having an interesting discussion with a regular reader of theFrontsteps, where I first posted my chart on Noe Valley Percentage Change from All-Time High. He disputes the fact that Noe Valley has fallen by 30% from its all-time high (reached in March of 2008) because he claims — I think — that March was aberrational. I’ve looked again at the data for that month and I disagree. What’s more I think that if you look simply at median prices (moving averages), they show a pretty extended upward trend from the beginning of 2006 through March 2008, with the exception of a dip during the Fall of 2007. Here’s the chart (click to enlarge). Enough said. I’m moving on to another subdistrict.
-
-
Recent Posts
- With Facebook Not Looking So Good, Is the Bloom Off the Rose in San Francisco’s Residential Home Market
- Social Media Boom Fuels San Francisco’s Rental and Home Sales Market
- San Francisco Housing and Rental Markets: Choose a Rock or a Hard Place
- Listed to Luxe in Under 30 Days
- Giving Credit Where It’s Due
-
construction TICs Market news ken rosen Credit crunch 2010 Bernanke home premium DOM Buyers trends Data Forecasts Pacific Heights fisher school condominium condos San Francisco UC Berkeley SF real estate Blogging Sonders District 5 Economy Tenancy In Common Market New York Times case-shiller Mortgages Marketing interest rates 2009 tax credit Front steps median price Rants rent vs buy Condominiums Nouriel Roubini Noe Valley single family homes luxury homes single family Charts 729 elizabeth street
Categories

