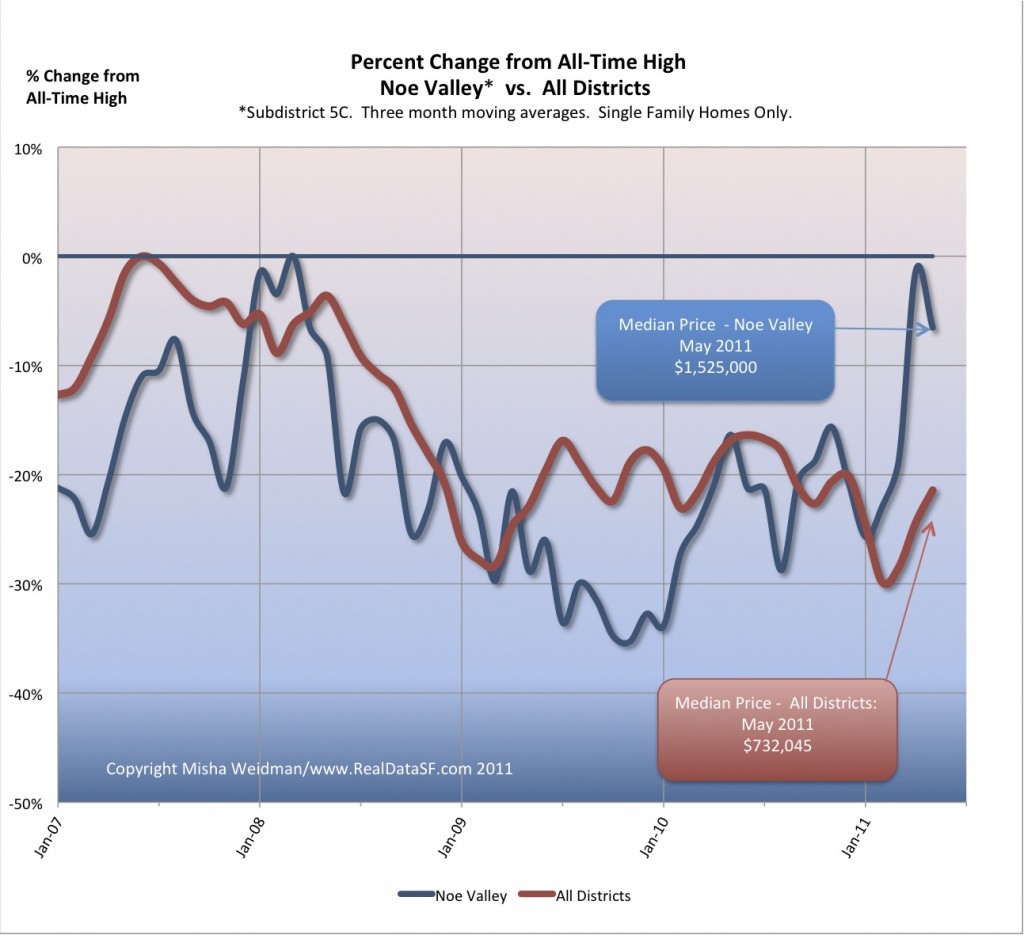
While single family home prices for San Francisco as a whole can’t seem to recover beyond being around 18% down from their all-time highs, Noe Valley home prices have come roaring back since the start of the year. The three month moving average for April was down just 1% from its all-time high of March 2008. In May, the moving average slipped back to 6.5% off the all-time high. Take a look (click to enlarge):
 That’s a pretty impressive recovery, especially since the news coming out of the Case-Shiller Index for the state of the national housing market continues to be bleak.
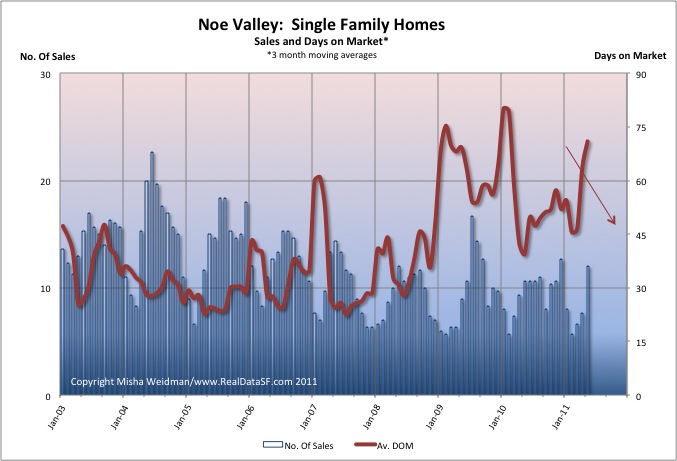
Indeed I suggested in May that Noe Valley was showing signs of life based on improving sales volume, and it looks like that trend is continuing — at least for now. Here’s a chart that shows both the number of sales per month and average Days on Market (DOM), all the way back to 2003.
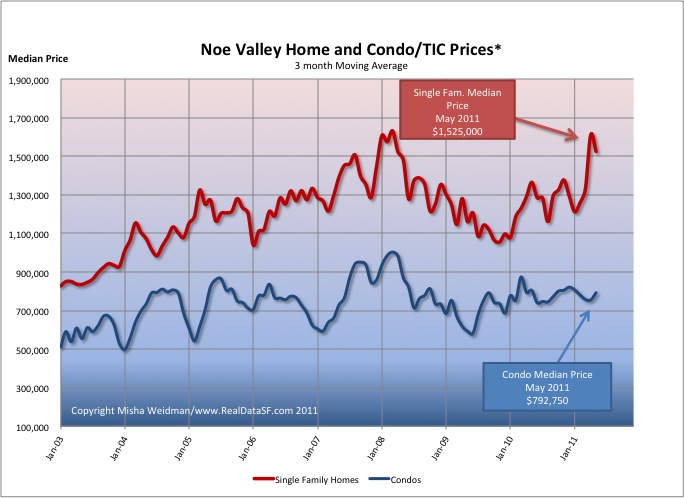
Now bear in mind that we are talking about a tiny area and hence typical sales volumes of between 5 to 15 units per month (plus about the same again in condo/TIC). But the current sales rate seems is neither particularly high or low, which suggests that the price increase is real. Here’s a chart showing both home and condo/TIC prices through May 2011 (click to enlarge):
If there’s trouble brewing on the horizon — and there always is, no? — it’s in the recent steep increase of Days on Market shown in the penultimate chart. In May, the three month moving average for the number of days it took for a property to go from listed to accepted offer (not closing) rose to 71 days. I’ve suggested previously that DOM seems to track price movement (inversely) pretty closely. If so, Noe Valley’s prices might soon start heading south again.


