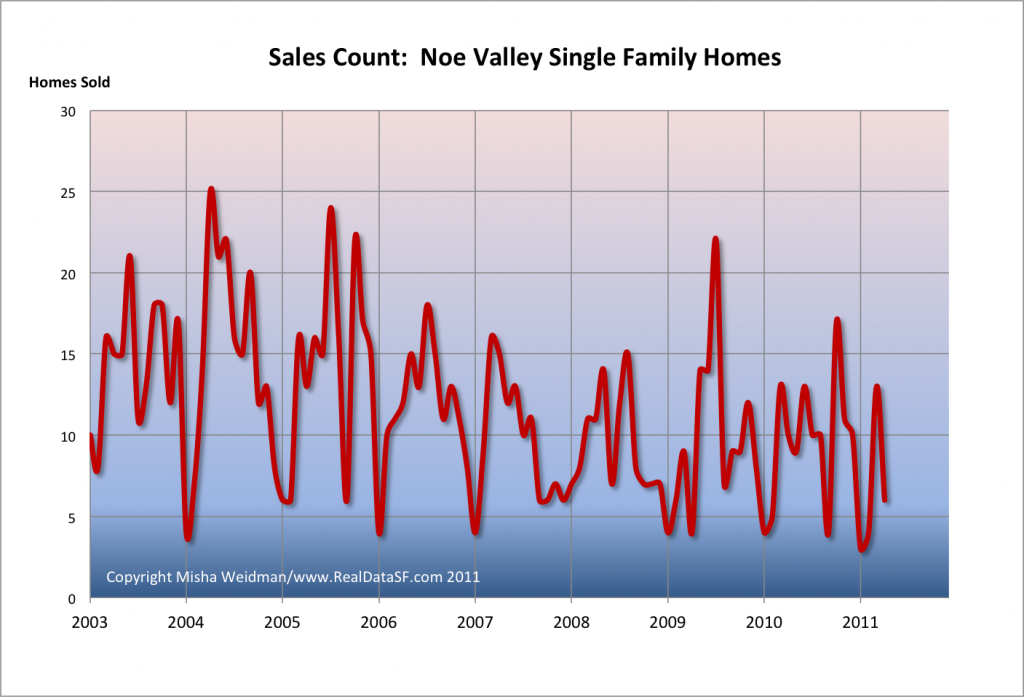
January is the cruelest month for the housing market. Every winter, sales flatline for a month or two, before reviving with the spring.
This year, there were just seven sales in Noe Valley (Subdistrict 5.C) in January and February. That’s the worst showing in my data set, which goes back to 2003. Things picked up smartly, however, in March. Take a look (double click the chart).
Thirteen sales may not be anything to crow about, but at least it’s a sign of life. In fact, it matches the number of sales from March 2010 and is the best March we’ve had since 2007.
On the other hand, maybe T.S. Eliot was right: April, with just 6 sales, looks pretty cruel. In most previous years back to 2003, April’s sales are about the same or higher than March’s. Not this year though.
Given all the bad news coming out of Case Shiller about the state of the housing market, one might conclude that Noe Valley is looking double-dippey. But I think not.
Why? First of all sales reflect activity a month or more earlier. There’s no doubt it was a cold and dreary winter. April’s sales figures just confirm that.
Secondly, people are really buying out there. Two of my clients went into contract in April. Suddenly, houses that no one wanted to touch are being snapped up (see my blog on 285 Douglass — but there are others as well). In fact, fourteen houses went from “active” to “active contingent” — meaning they’re in contract but there are contingencies remaining — in April. Many of those are going to show up as “Sold” in May.
Will it last? As long as our august representatives in Washington have enough sense not to kill the economy just as it’s beginning to recover, maybe we can look forward to a “modest warming trend.”

