My last post was about the fact that Noe Valley median home prices are still down 30% from their all time highs despite a smart recovery in median home prices city-wide. This, despite my sense that there seem to have been a burst of Noe Valley homes hitting the market in the $2 million range and above recently.
There are some regular bloggers/posters on other sites who make the valid point that “mix” — what price range of houses are selling — can distort median prices and therefore give an inaccurate picture of what’s happening to the market overall. In a nutshell, they say, just because the median price for an area has fallen by 20% doesn’t mean the value of your home has fallen by that much. (Here’s a great little blog post that explains the mix problem with a table.)
I completely agree with these reservations and have said as much here. However, I’ve also said that pretty much everyone in the real estate biz — not just your friendly professional real estate association — uses medians to track prices. Even if they don’t reflect everything about the market, they’re surely better than flying blind.
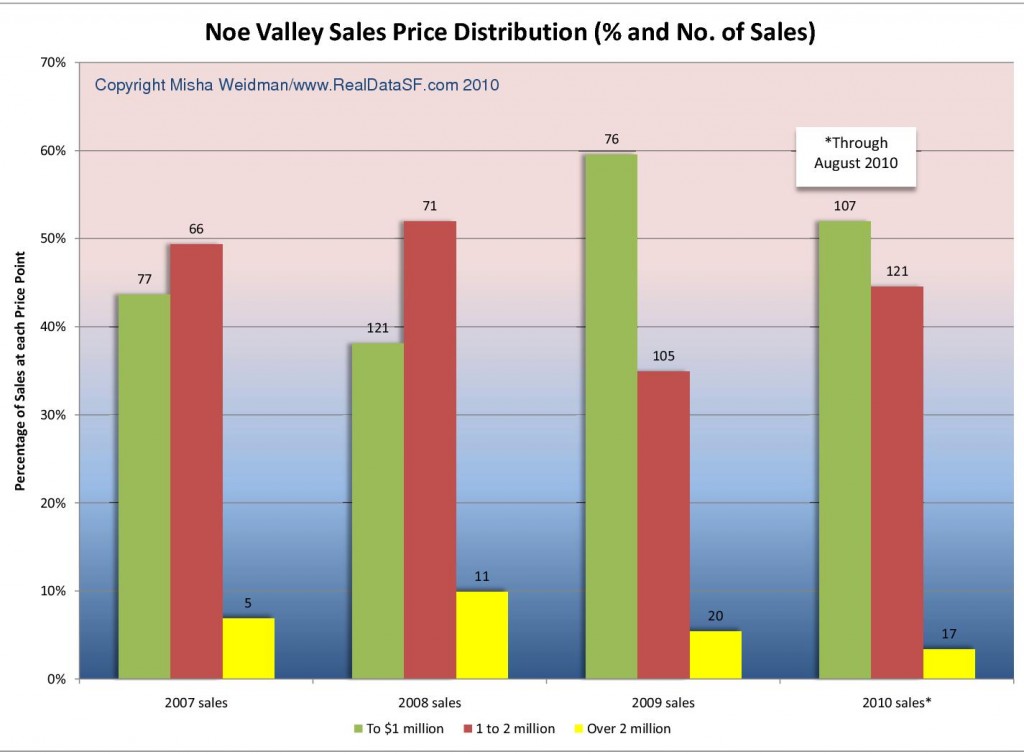
Nevertheless, your intrepid blogger decided he did want to take a closer look at Noe Valley’s surprising slump and how “mix” might be affecting median values. Here’s a chart that breaks down the number of sales by price point as a percentage of total annual sales (shown on the left axis). Actual number of sales at each price point is shown on top of the corresponding bar.
Choosing which price points to use is always going to be somewhat arbitrary, but I figured that below $1 million would catch most of the condos and TICs; the $1 to $2 million range would pick up most of the single family homes; and above $2 million would accurately reflect Noe Valley’s high(est) end.
The chart clearly reflects what actually happened in the market over the last few years. In 2008 — the top of the market for Noe Valley — middle and high end home sales increased while lower end sales declined to under 40% of total sales. In bust-year 2009, the bottom end ballooned to nearly 60% of total sales, just as you’d expect. And in 2010 so far, sales to $1 million have continued to dominate the market, representing over half of all homes sold. Meanwhile the middle of the market has come back somewhat, while the top end continues to languish. This is all completely consistent with why Noe Valley’s median home prices are looking down at the mouth.
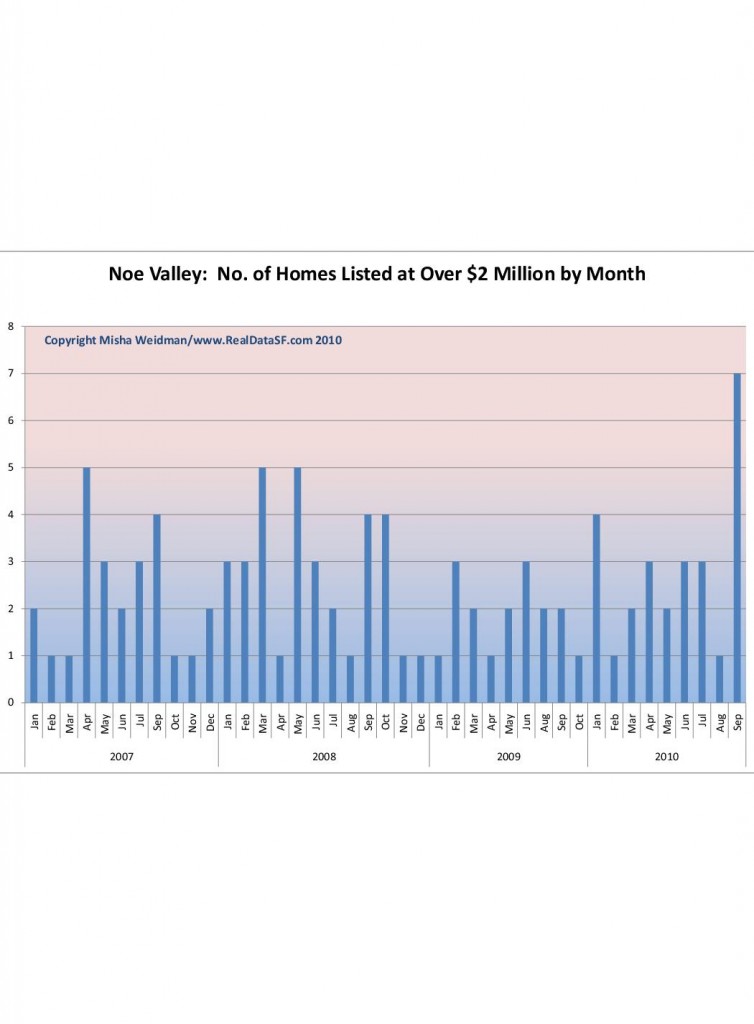
Apparently, the word did not get out to sellers of high end homes in September. Here’s a chart that shows the number of listings over $2 million coming to market by month.
What’s going on here? Who know. Maybe September’s just an aberration. Notwithstanding the occasional exception like 729 Elizabeth (went into a no-contingency contract for over $2.495 million in less than 8 days), high end homes are generally not moving very fast, or not at all. There seem to be a lot of homes languishing in the $1.6 to $1.8 million range, despite top-shelf finishes and generally workable layouts. Even with rock-bottom interest rates, it may be a long cold winter for these sellers.
***
And a favor to ask: Marc, my media guru, has suggested that I add a Facebook “Like” button to the end of my posts. If you like what you see, please consider clicking on it to share with your Facebook friends.


