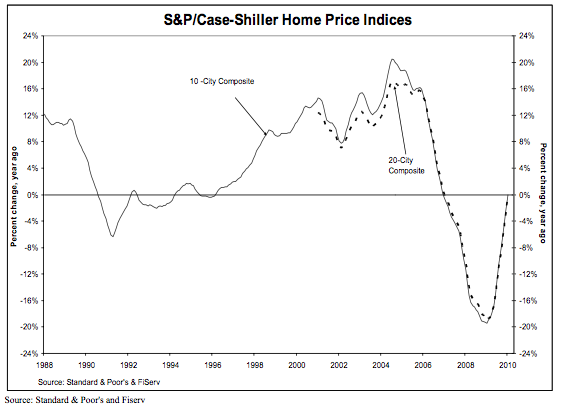
Last week, Case-Shiller released January data for its closely watched national housing index. Nationally, things are looking up – well, make that flat. And that’s good news. In the wonderfully backward language of the report, the index’s year over year rate of decline “improved.” Basically, we are back to where housing values were a year ago.
Since for most of us our homes represent our biggest asset, that’s pretty good news when you consider how bleak things looked back in March of 2009. Just think of how you were feeling about your 401(k)s.
But before you break out the champagne, consider that national home prices have now “recovered” to levels last seen in Autumn 2003. That’s over six years of appreciation wiped out.
The San Francisco Metropolitan Statistical Area (that’s 5 of the 9 Bay Area Counties, folks) is up 15.2% from its trough value. Case-Shiller does not break out San Francisco proper from the much larger MSA. However, I calculate that median prices in January were up just 10% from the lows reached in March 2009. (I use 3 month moving averages, which approximates the seasonal adjustments the CS Index uses.) To see how SF did through 2009, check out my blog and charts here.


I do agree with all the concepts you have introduced in your post. They’re very convincing and will certainly work. Nonetheless, the posts are too quick for newbies. May just you please prolong them a little from subsequent time? Thanks for the post.