Back in May 2009, I showed that Noe Valley was not immune from the slump in prices affecting the rest of the city, despite suggestions to the contrary from real estate agents, mavens and media.
Have things gotten any better? Well, no. And maybe.
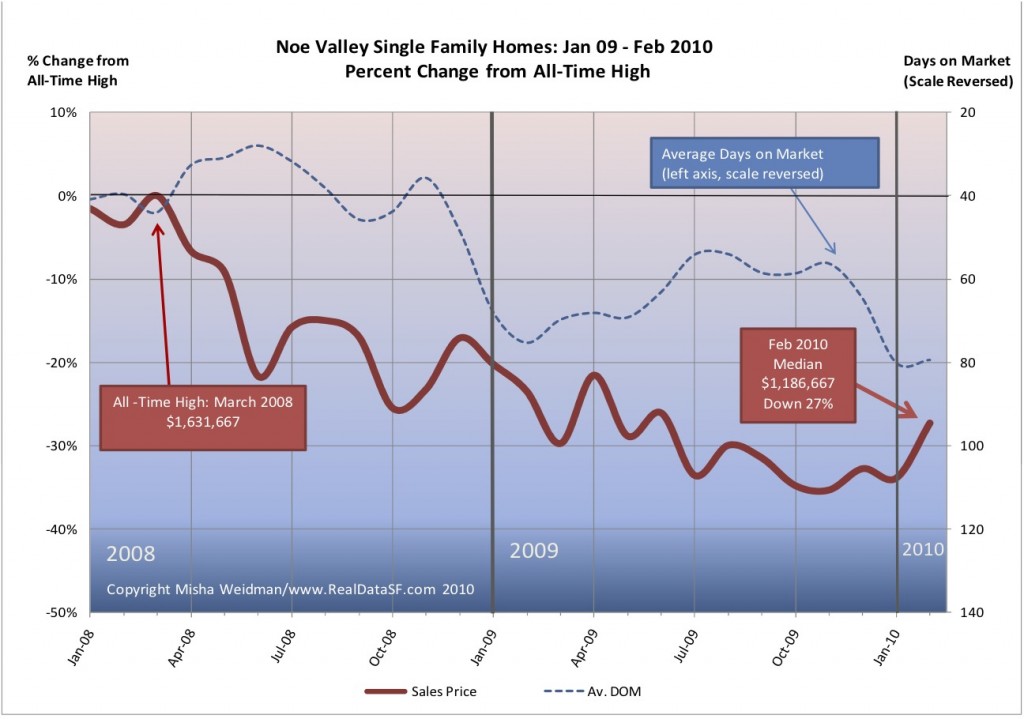
Here’s a chart showing percentage change in single family home prices for the last 14 months, relative to their all-time highs (click to enlarge). (All figures are 3 month moving averages.)
After reaching an all time high in March 2008, prices plummeted. Just a year later, in the midst of fears of a global Depression, home prices were down 30%. Did things get better? No, they got substantially worse. Despite an impressive city-wide recovery in 2009, with prices going from 30% down to around 18% down for single family homes at year’s end (see more detail here) , Noe Valley home prices continued to retreat. In October and November 2009, prices were down 35%. At year’s end, they’d barely clawed back two percentage points. Not surprisingly, days on market (DOM) remained stubbornly high for all of 2009.
Still, with cherry blossoms busting loose all over Noe Valley’s quiet streets, there certainly seems to be a change in the air. There are many more listings coming onto the market and there’s even the occasional feeding frenzy over a clean, well-priced home. These go in a matter of days, not weeks. Maybe that upturn in prices for January and February suggests a continued warming trend.
In the next few posts, I’ll look at Noe Valley in more detail, including how condos have fared.


great stuff congratulations! .. I ended-up here from socketsite … keep up the good work!
Nice Misha. Depressing and depressed as prices are.