As I mentioned in my previous post, I’ve had several questions about per square foot prices recently. There’s no doubt that it’s a very useful metric, for the obvious reason that it allows you to get closer to an “apples to apples” comparison of the value of two different properties that are different in size. Of course, that leaves all sorts of other variables — location, amenities, etc. But if, say, you’re looking to make an offer on a property, certainly you’d want to start by looking at what other properties in the same area have been selling for on a per square foot basis, and then use that to see if the property you’re interested in is in the ballpark.
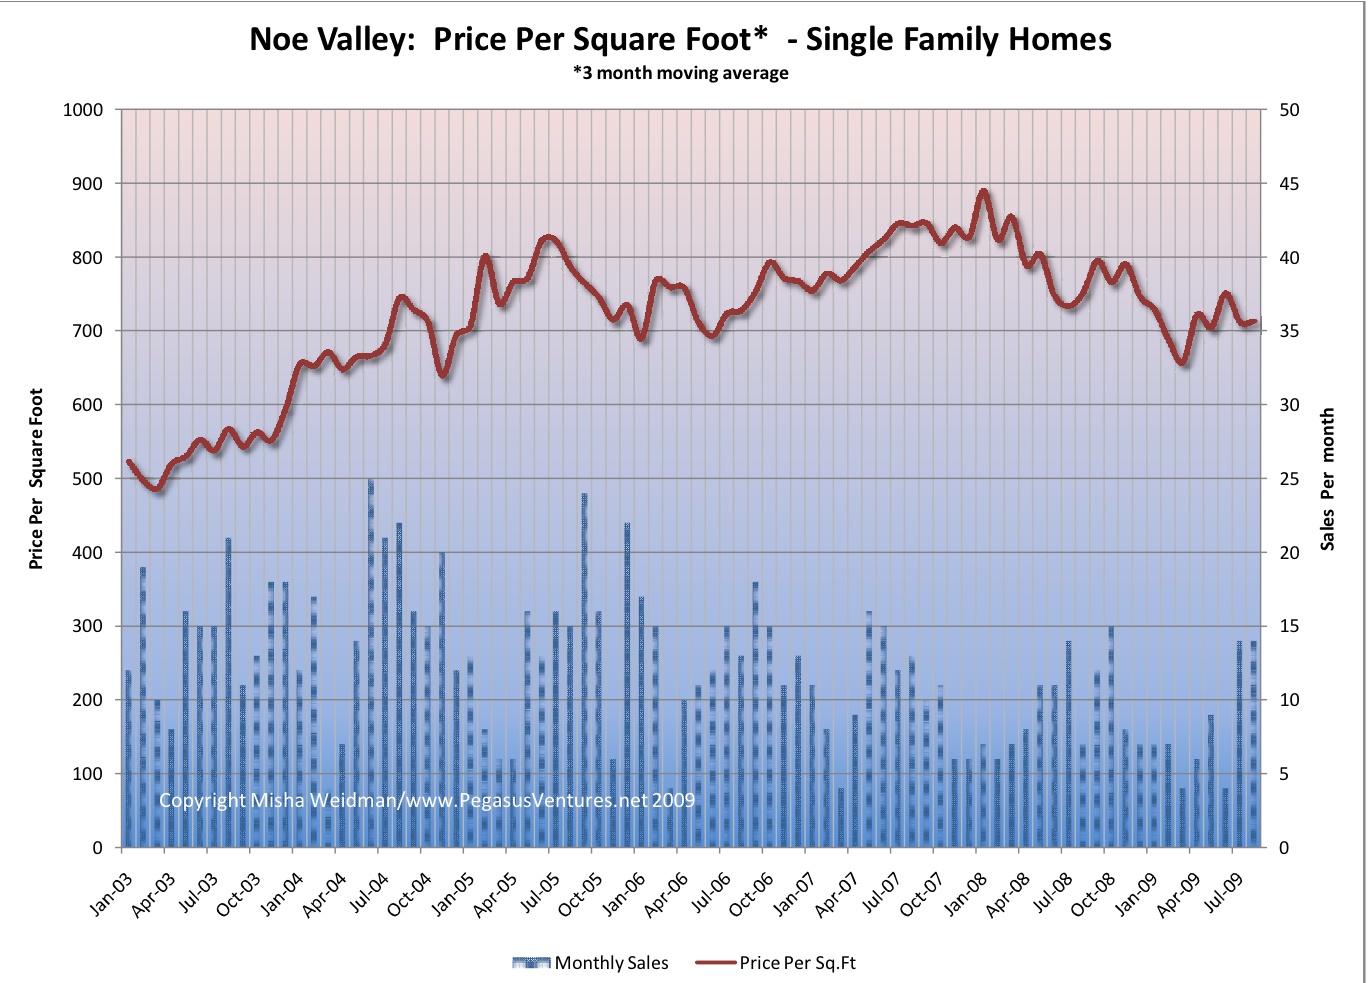
Since I live in Noe Valley, I’ll readily admit that I tend to follow my neighborhood more closely than other areas. No great surprise there. So here, without further ado, is a chart showing the price per square foot for single family homes in “core” Noe Valley (click to enlarge).
Rather than run the chart as Percentage Change From All-Time High, as I usually do, this simply shows price per square foot as a 3 month moving average. I’ve added the “number of sales” per month, plotted on the right-hand axis as well. Note that low monthly sales volumes ( no surprise, given the small geographic area) will make the data less statistically reliable. In most months, there are less than 15 sales.
While we’re on the subject of sales volume, I recently read an advertisement in the local rag, The Noe Valley Voice, from a local real estate company touting how sales volume in Noe Valley is up, compared to San Francisco as a whole. So what? As I’ve stated before in the context of the luxury home market, I really haven’t found any correlation between volume and price. Though it may be a little difficult to tell from this chart, I don’t see it here either. For example, sales volumes were down and falling during the autumn months of 2007, but that’s when prices started climbing towards their all-time high in early 2008. Likewise, sales volumes were increasing through the first 6 months of 2008, even as prices were sliding.
The bottom line is that Noe Valley homes are still fetching north of $700 a square foot, and that’s after a protracted slide. Sure, the price per square foot is down substantially from the near- $900 a foot that they hit back in January 2008, but it’s a pretty well-heeled foot nonetheless.


I’m assuming square foot here is for the building, not the lot. Is this correct? Is the fact that most lots are the same size in NV baked into this statistic?
Yes, Karin. Per sf means for the building, not the lot. Most lots in SF are 25×100. There could be some adjustment built in to the price per sf for lots that are bigger or smaller, but generally in urban environments it’s the amount of living space that counts.