Case-Shiller published its closely watched indices yesterday. Hooray! The broadest CS index shows that the rate of decline in the nation’s largest housing markets has reversed in recent months. Now we’re only going down 16% year over year instead of 20%.
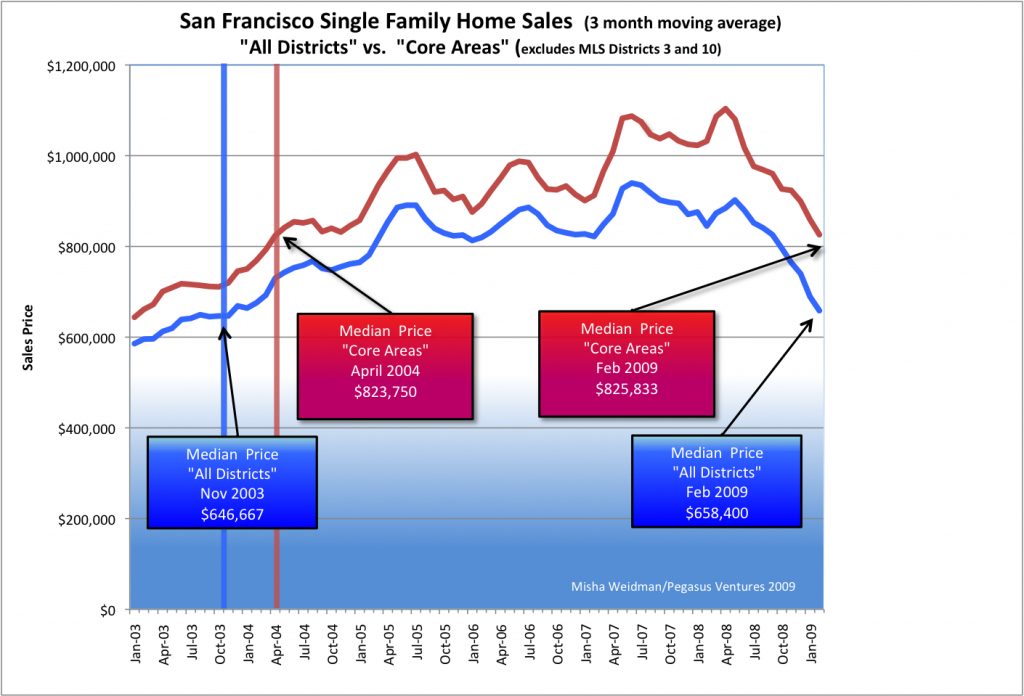
They also point out that we are now back to 2003 values, which also holds true of San Francisco. Here’s my chart from an April blog:
Before you go out and celebrate, Case-Shiller has “San Francisco” down a whopping 26.1% year over year. Why the quotes? Because it’s really the “San Francisco-Oakland-Fremont, CA Metropolitan Statistical Area” and it includes ALL of Alameda, Contra Costa, Marin, San Mateo, and … San Francisco County. That’s 5 counties folks, a factoid often omitted even by such august publications as the New York Times (see today’s front page article).
Now here’s the “good” news. My data says that the San Francisco we live in was down “just” 5.7% in June 09 year over year for homes. Take a look under the Market Trends tab for annual and monthly data for the City and specific MLS Districts. (By contrast, condos are down 15% year over year. That also happens to be how much they’re down from their all-time highs, which occurred right about a year ago. See my previous post.


