Noe Valley has its 24th Street shops and cutesy cafés. Cole Valley has, well, its Cole Street shops and cutesy cafés. The two neighborhoods have been engaged in a friendly battle for the hearts of San Francisco homeowners for as long as I can remember.
After doing a guest post on Noe Valley price trends at theFrontSteps a few weeks ago, Alex, tFS’s friendly editor, suggested that I do a side-by-side comparison of sales trends in Cole Valley and Noe Valley.
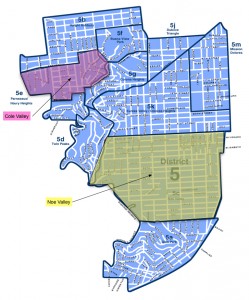
Great idea, I thought! Trouble is, Cole Valley sits within a tiny subdistrict of the MLS (see the pink area below?) and as a result, there very few transactions from month to month.
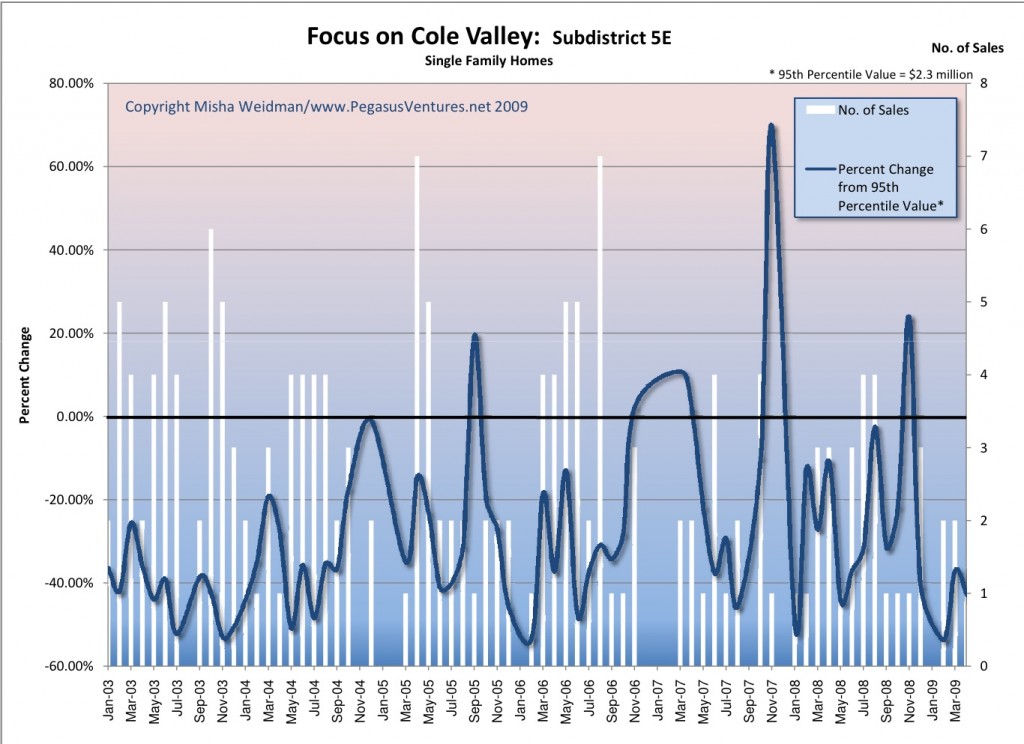
That makes data crunching hard. Maybe even meaningless. Check out the white bars in this chart (click). They represent the number of single-family home sales per month back to January 2003. (Number of sales is tracked on the right side of the chart; percentage change from “high” is tracked on the left side.)
You can see that there are many months where only one or two houses sold. There are some months where there were no sales at all. It’s tough to extrapolate monthly sales trends under those circumstances and dangerous to assume that an “all-time high” is meaningful when it’s based on only one or two data points.
So instead of running percentage changes off of median monthly values, as I had done for Noe Valley, I ran the percentage changes off the “95th Percentile” value of all sales occurring between January 2003 and April 2009. The 95th Percentile value represents a “high”, while excluding the potentially aberrational top 5% of sales. Aren’t you glad you asked? (Special thanks to my wife, Nina, who looks over my shoulder at a lot of my statistical analyses — she’s the one with the one with the PhD in data-crunching.)
After looking at this chart, I sort of threw up my hands. With only 179 sales in over 6 years, it’s not sensible in my view to draw conclusions about monthly trends in Cole Valley, let alone to compare them to Noe Valley, where the “core” area alone — Subdistrict 5C — had over 900 sales during the same period.
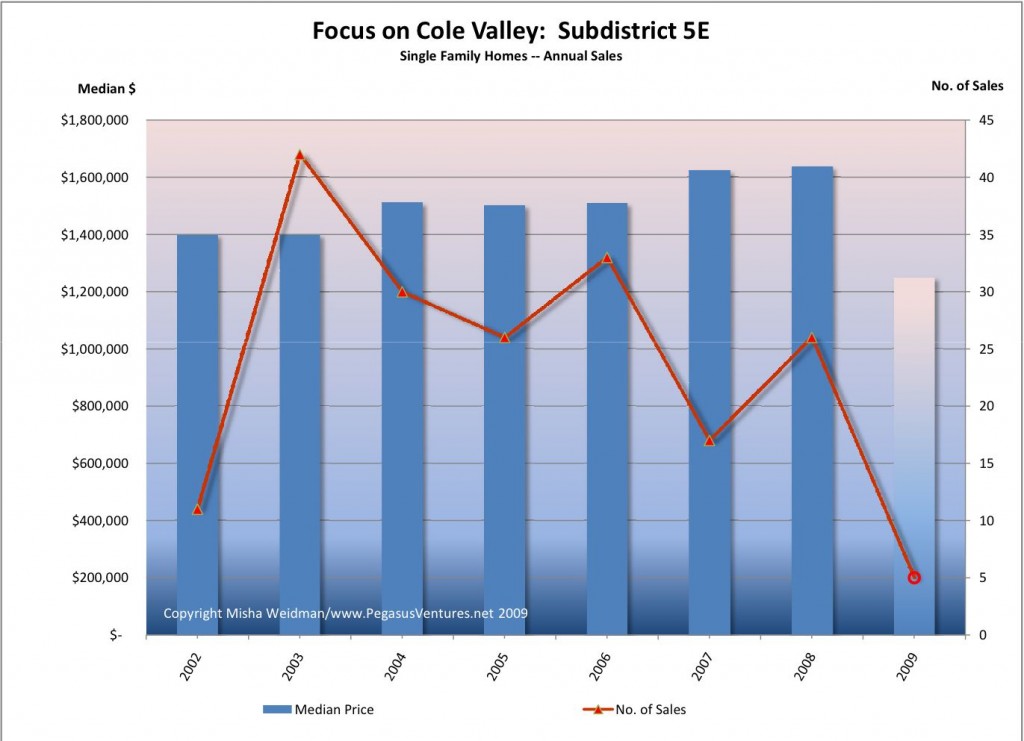
So I re-ran the numbers and calculated medians based on annual sales. The second chart (click) shows the results.
I think this is much easier to understand. Again, with so few sales, one should be careful about drawing any conclusions, and with only 5 sales in 2009 so far, I think it’s too early to conclude that the apparent drop in median prices for 2009 will continue to be accurate. Rather, I’d say that Cole Valley seems to have been holding up pretty well.
Stay tuned. I can’t help myself. Coming up, Cole Valley and Noe Valley go head to head.


you know my dear friend – I think all this data is great but I think the cool areas keep up pretty well – end of story. How about you study and control your data for the charm of the neighborhood, the age of the house, the access to credit. All kidding aside. I agree with your conclusion and will add this: There are no sales because people are happy in this neighborhood. And some buyers buy to stay in their house… High demand little sales, great neighborhoods, how many houses in this neighborhood compared to others? Your detractor is wrong.