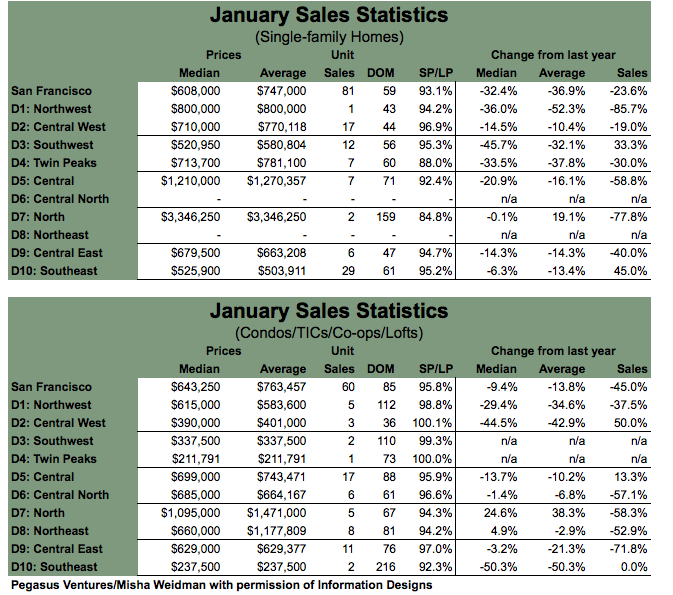
Here’s the latest sales data broken down by MLS District. Full reports are available here under the Market Trends Tab and are well worth a look.
Median and Average prices are down substantially year over year for single family homes in all districts except District 7 (“North”, which includes top-shelf enclaves like Pacific Heights and the Marina), but with only 2 sales for the month in that area, it’s not a meaningful statistic. Indeed, as I’ve pointed out in previous blogs, sales drop off so dramatically every year during December/January that I’d be cautious reading too much into the statistics for those particular months.
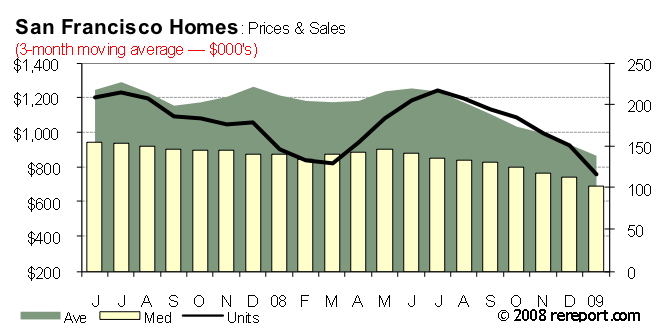
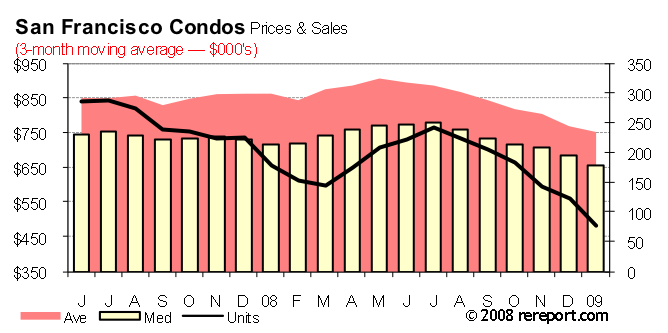
However, the three month moving average for SF as a whole, which smooths out the seasonal fluctation, has clearly been heading south since last summer, as these two charts show (also available, much more prettily, under that Market Trends Tab):
Details on individual MLS districts to follow in another post.


