Yup, that’s right folks. According to the well-known and well-respected Case-Shiller Index published by Standard and Poor’s, San Francisco home prices in July 2008 were down a whopping 24.8% from a year previous. How can this be, when you read right here that median prices were down YOY (year over year) a “mere” 11.3% in September (see Oct 23 blog below) and just 5.5% YOY for July 2008 — see my market trends archive.) More realtor fluffery, you huff, designed to make the credulous public believe that things are not so bad.
Actshooly (actually), the reason’s simple. As is often the case when widely quoted indexes talk about a city, what they’re really referring to is a Metropolitan Statistical Area (MSA), a much larger geographical area. So “San Francisco” doesn’t mean our little piece of heaven, no. It means… all of Alameda, Contra Costa, Marin, and San Mateo COUNTIES as well as San Francisco county.
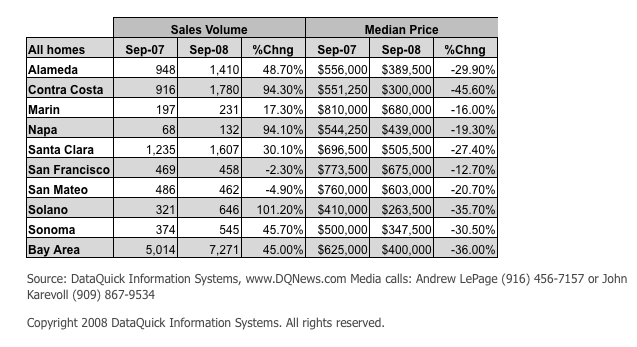
According to the latest release from Dataquick, median home prices in Contra Costa County were down a whopping 45.6% YOY for September 2008. No great surprise considering that it includes ground-zero overbuilt subdivision train-wreck areas like Pittsburgh and Antioch. Take a look:
With Alameda County down 30% and even Santa Clara County down 27.4%, it’s clear how the other counties in the San Francisco MSA are dragging the “San Francisco” index down. Feel better now?
And a PS. Dataquick shows San Francisco County as down 12.7% for September versus my 11.3%. I get my numbers from a service that pulls them directly from the MLS, then I use their spreadsheets to dig deeper when necessary. I’m looking into why there’s a discrepancy between my numbers and Dataquick’s.

