Several readers and clients have asked me recently about price per square foot metrics. Certainly, if you’re trying to figure out how much a home is worth, it helps to get a sense of value by knowing what houses (or condos) are going for in the area on a per square foot basis and multiplying that by the size of the house in square feet. Elementary my dear Watson.
However, others have been curious about whether there might be a discontinuity between the median price of homes and the median price per square foot, and what that might mean, especially in the context of how much each has fallen from its all-time high. So I decided to take a look.
The first thing I did was check how often price per square foot was not reported in the MLS (Multiple Listing Sales database) that brokers and other real estate tracking companies use to compile their sales data. Frequently agents don’t report this because they don’t have any reliable data on how big the house is that was sold or they’re afraid of being sued if they’re wrong. (I recently learned that when you buy a house in France, the seller must tell you how big it is, and if it’s smaller than stated, the Buyer has the right to adjust the price downwards. I wonder what happens if the house is bigger than expected.)
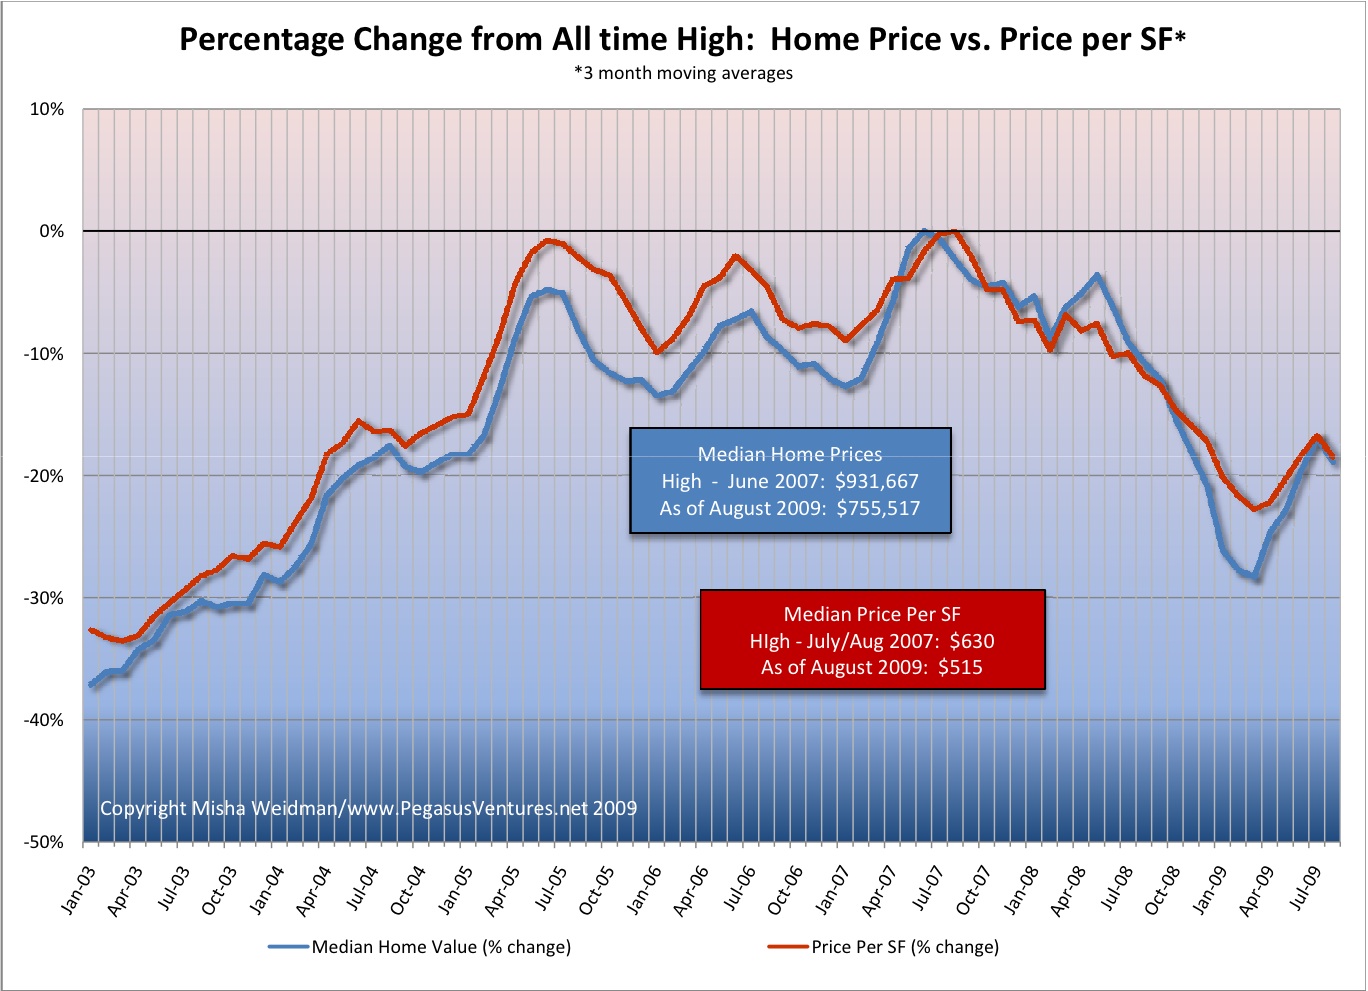
It turns out that in my database, which goes back to October 2002, price per square foot is reported about 80% of the time on single family home sales. That’s sufficient to be reliable, so here are the results (click to enlarge).
I would say that overall, and as you’d expect, price per home and per square foot have tracked pretty closely. It is interesting that during the terrible market freeze of early 2009, the median home price dropped noticeably more steeply than the price per square foot. There are several possible explanations. One is that smaller homes were selling better than bigger ones. Since home price can be reduced to the formula: Area (in square feet) x Price per SF, if home prices are dropping out of step with a drop in price per square foot, then the Area multiplier must be getting smaller faster. Furthermore, since smaller homes tend to be cheaper homes, this would give some support to the argument that the higher end of the market has been suffering more than the lower end. Even if that’s true, it seems to have been a short-lived phenomenon given that both metrics are back in sync as of August.
But the truth is that a lot of factors determine the selling price of a house, not just its size. Location, views, “curb appeal,” to name just a few. So I don’t really know how much you can glean just from looking at the areas of disjunction. For my part, I think this confirms that I’m on solid ground if I use median home prices to look at the state of the market over time. On the other hand, it also suggests that price per SF could work just as well, and it would be more helpful for people looking to do a value calculation for a particular home. So I might start using price per sf more frequently. Please chime in with your thoughts and suggestions.


Interesting Misha. It would also be interesting to see the percentiles of homes by square footage that were selling during the non correlated periods to see whether your offered explanation that lower end was selling better at the bottom holds true. I think you may have had the reverse in April (because of low inventories and a perception that there were bargains or low inventories?…) In any event it is very interesting. In my view there is a limit on using the price per square foot as a measure. What I mean is I think people buy with a total budget in mind and a range of square feet or rooms, not necessarily a price per square foot. So the total price and price per square foot is always likely to be off by some measure (maybe adjusted by the number of rooms or something like that), I can see 100 ways of cutting this data which could be useful. I think a statistician close to you or you should just run a correlation on the data and it will probably show you are on very solid ground.
I think normalizing value by price/sqft makes a lot of sense. Homes vary a lot: size, location, curb appeal, etc. So comparisons are difficult. Example: 2 homes at the same price… is that a large house in a bad location? Or a small house in a great location? How do you compare? But, if you normalized by size, then their relative value becomes apparent. It’s hard to normalize things like location or curb. But size is definitely a 1st order effect, easily quantifiable, and therefore straightforwardly normalizable. Normalizing the price by size just takes one more variable out. I think it’s a very sensible idea.